Bad Actor Analysis: Enterprise Web App For Reliability Engineers
When a conveyor breaks down at a mine, a group of engineers analyzes which component caused the failure. If the downtime becomes a pattern over time, they start a project to reduce it.
This type of project is called a Bad Actor Project, and the group responsible is known as Reliability Engineers.
Intro
Currently, each Reliability Engineer spends between 1-4 hours per week managing and analyzing data to identify potential Bad Actor Projects. They generate approximately $1750 per hour. In total, this amounts to around $12 million spent on data gathering across all sites.
Overview
Project Goal
Our team was asked by the Central Maintenance Group (Stakeholder) to create a tool that helps Reliability Engineers speed up their Bad Actor process, starting with the Identification phase - “Analyze raw data and select bad actors”.
Team & Responsibilities
UX Designer (me): User Interviews, Usability Testing, Wireframing, UI Design, Prototyping
1 Product Owner, 1 Scrum Master, 1 Dev Lead, 4 Developers
Timeframe
2022-2023

Initial Interviews - Getting To Know Our Users
To understand the target audience of our design, I conducted 8 interviews with Reliability Engineers from 4 different mine sites. The goal was to create a persona and map out their user journey.
First Contact Interviews
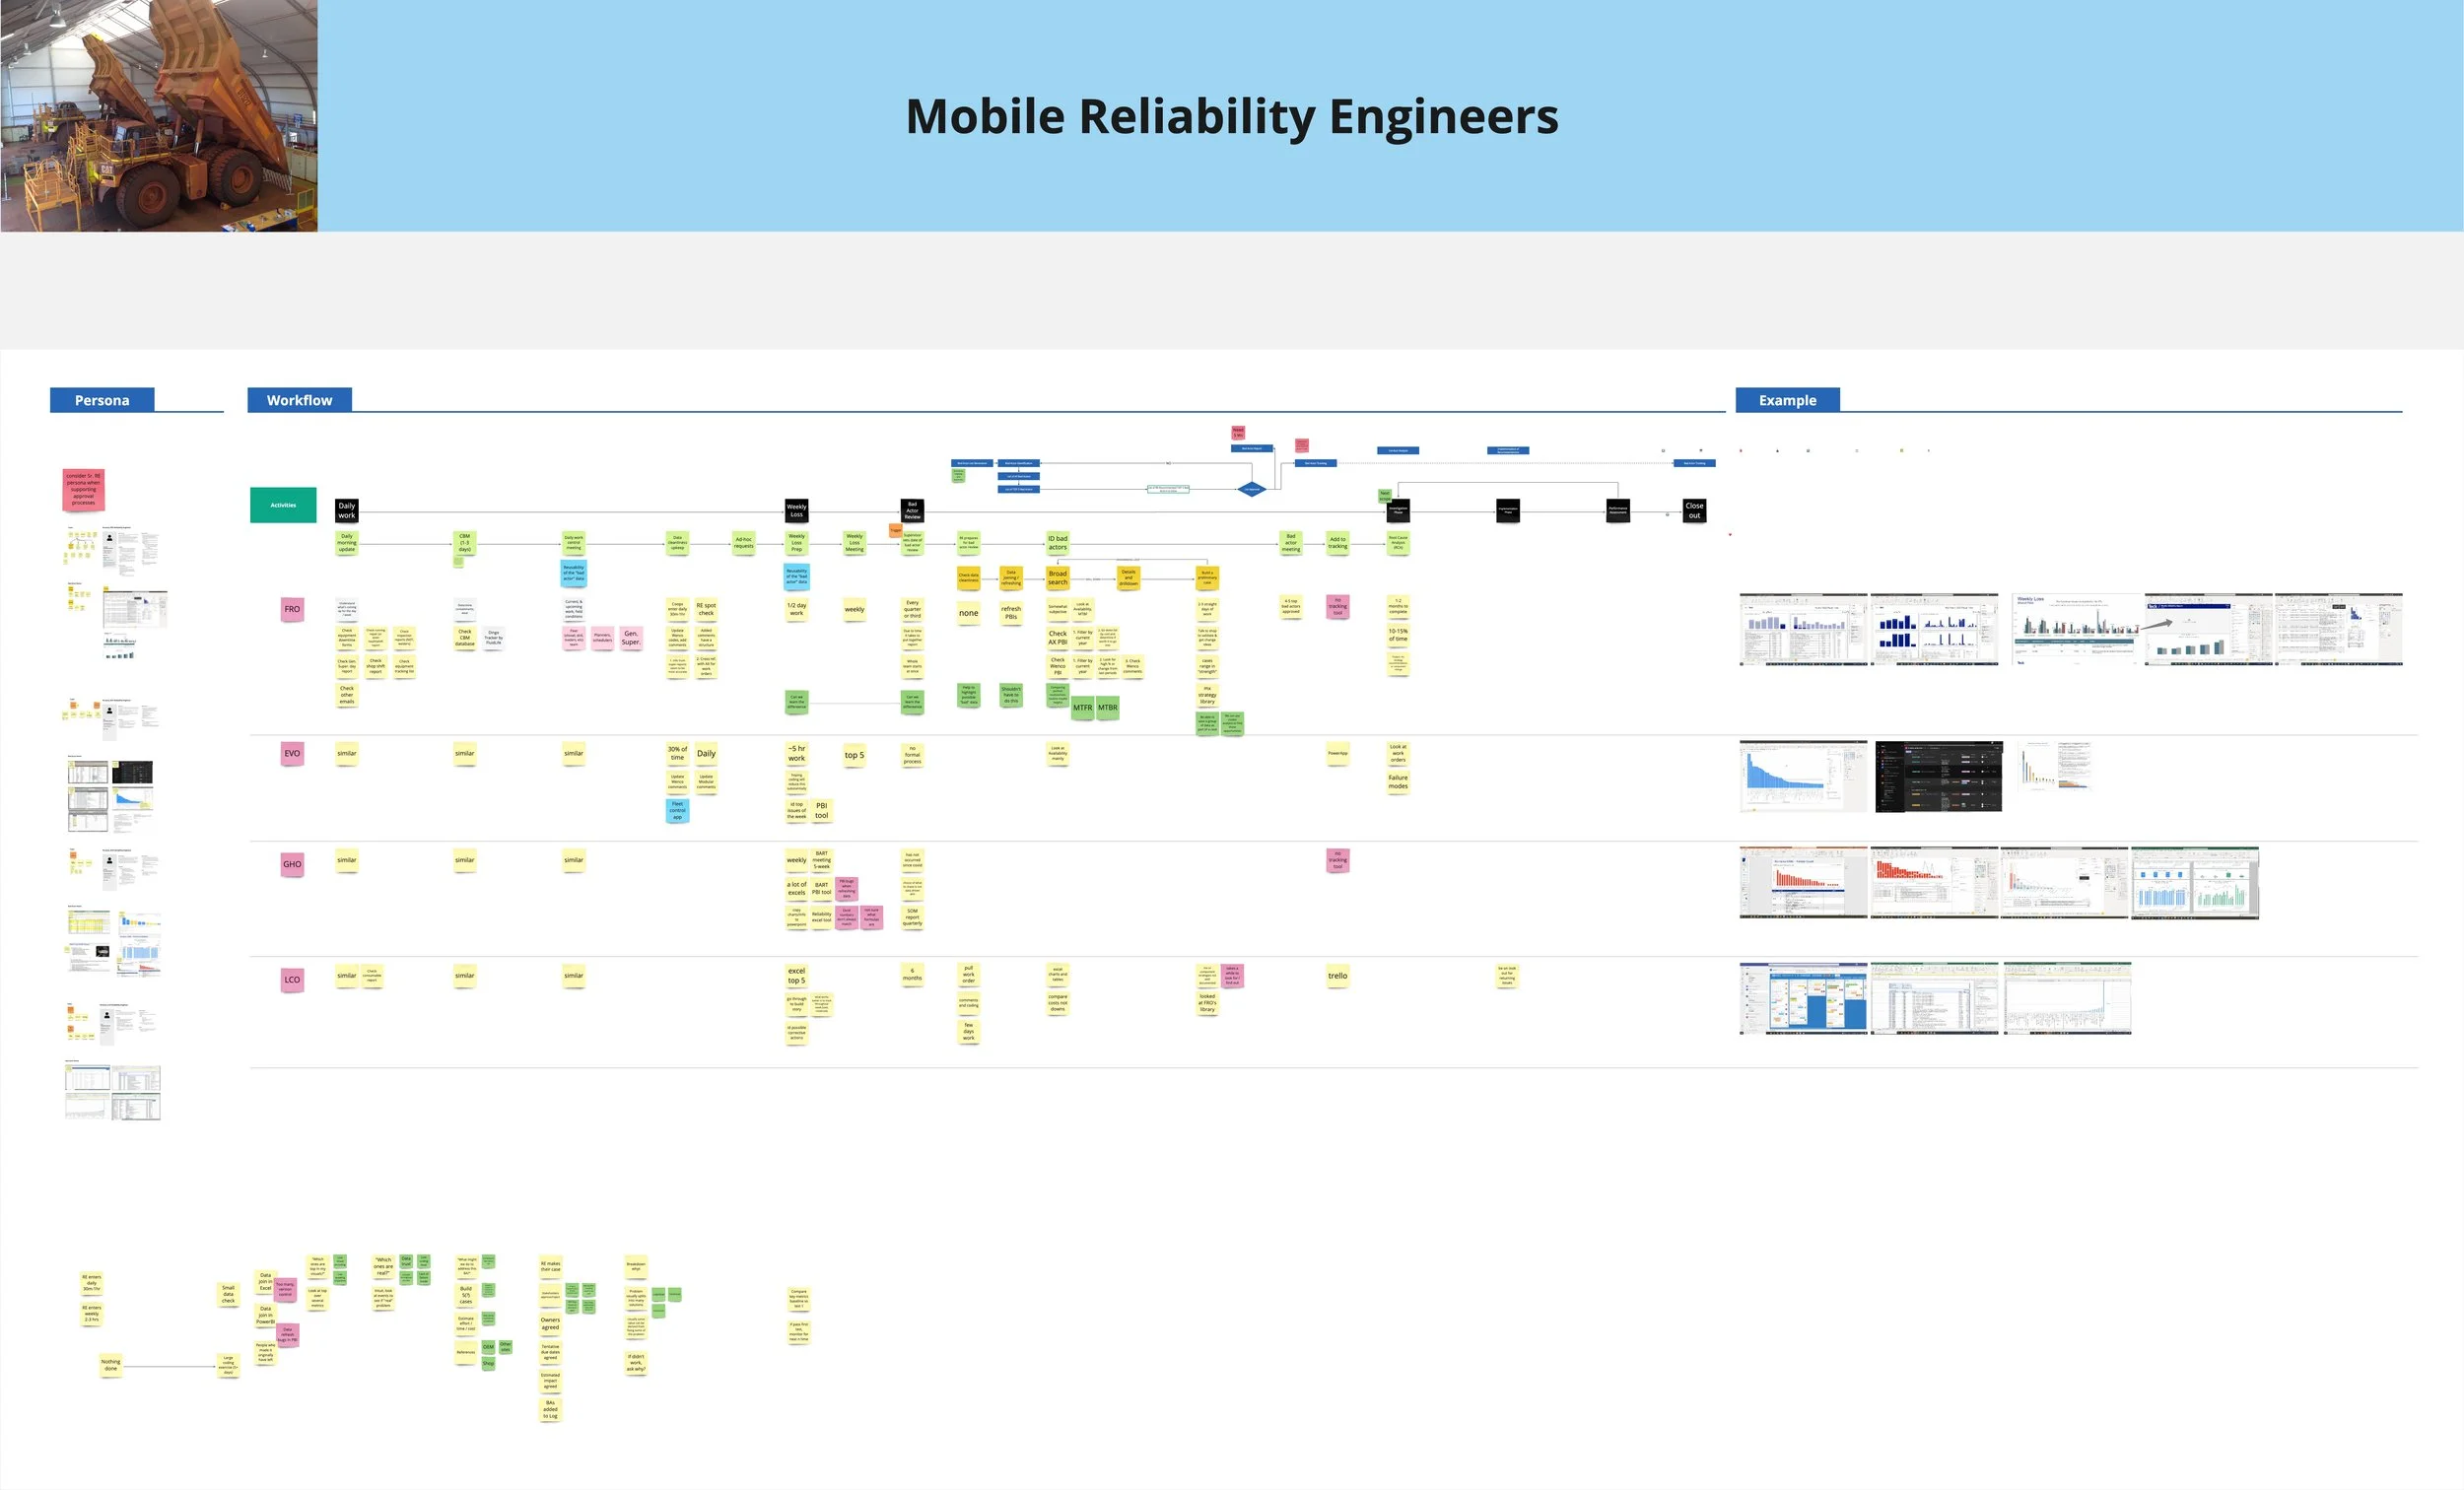
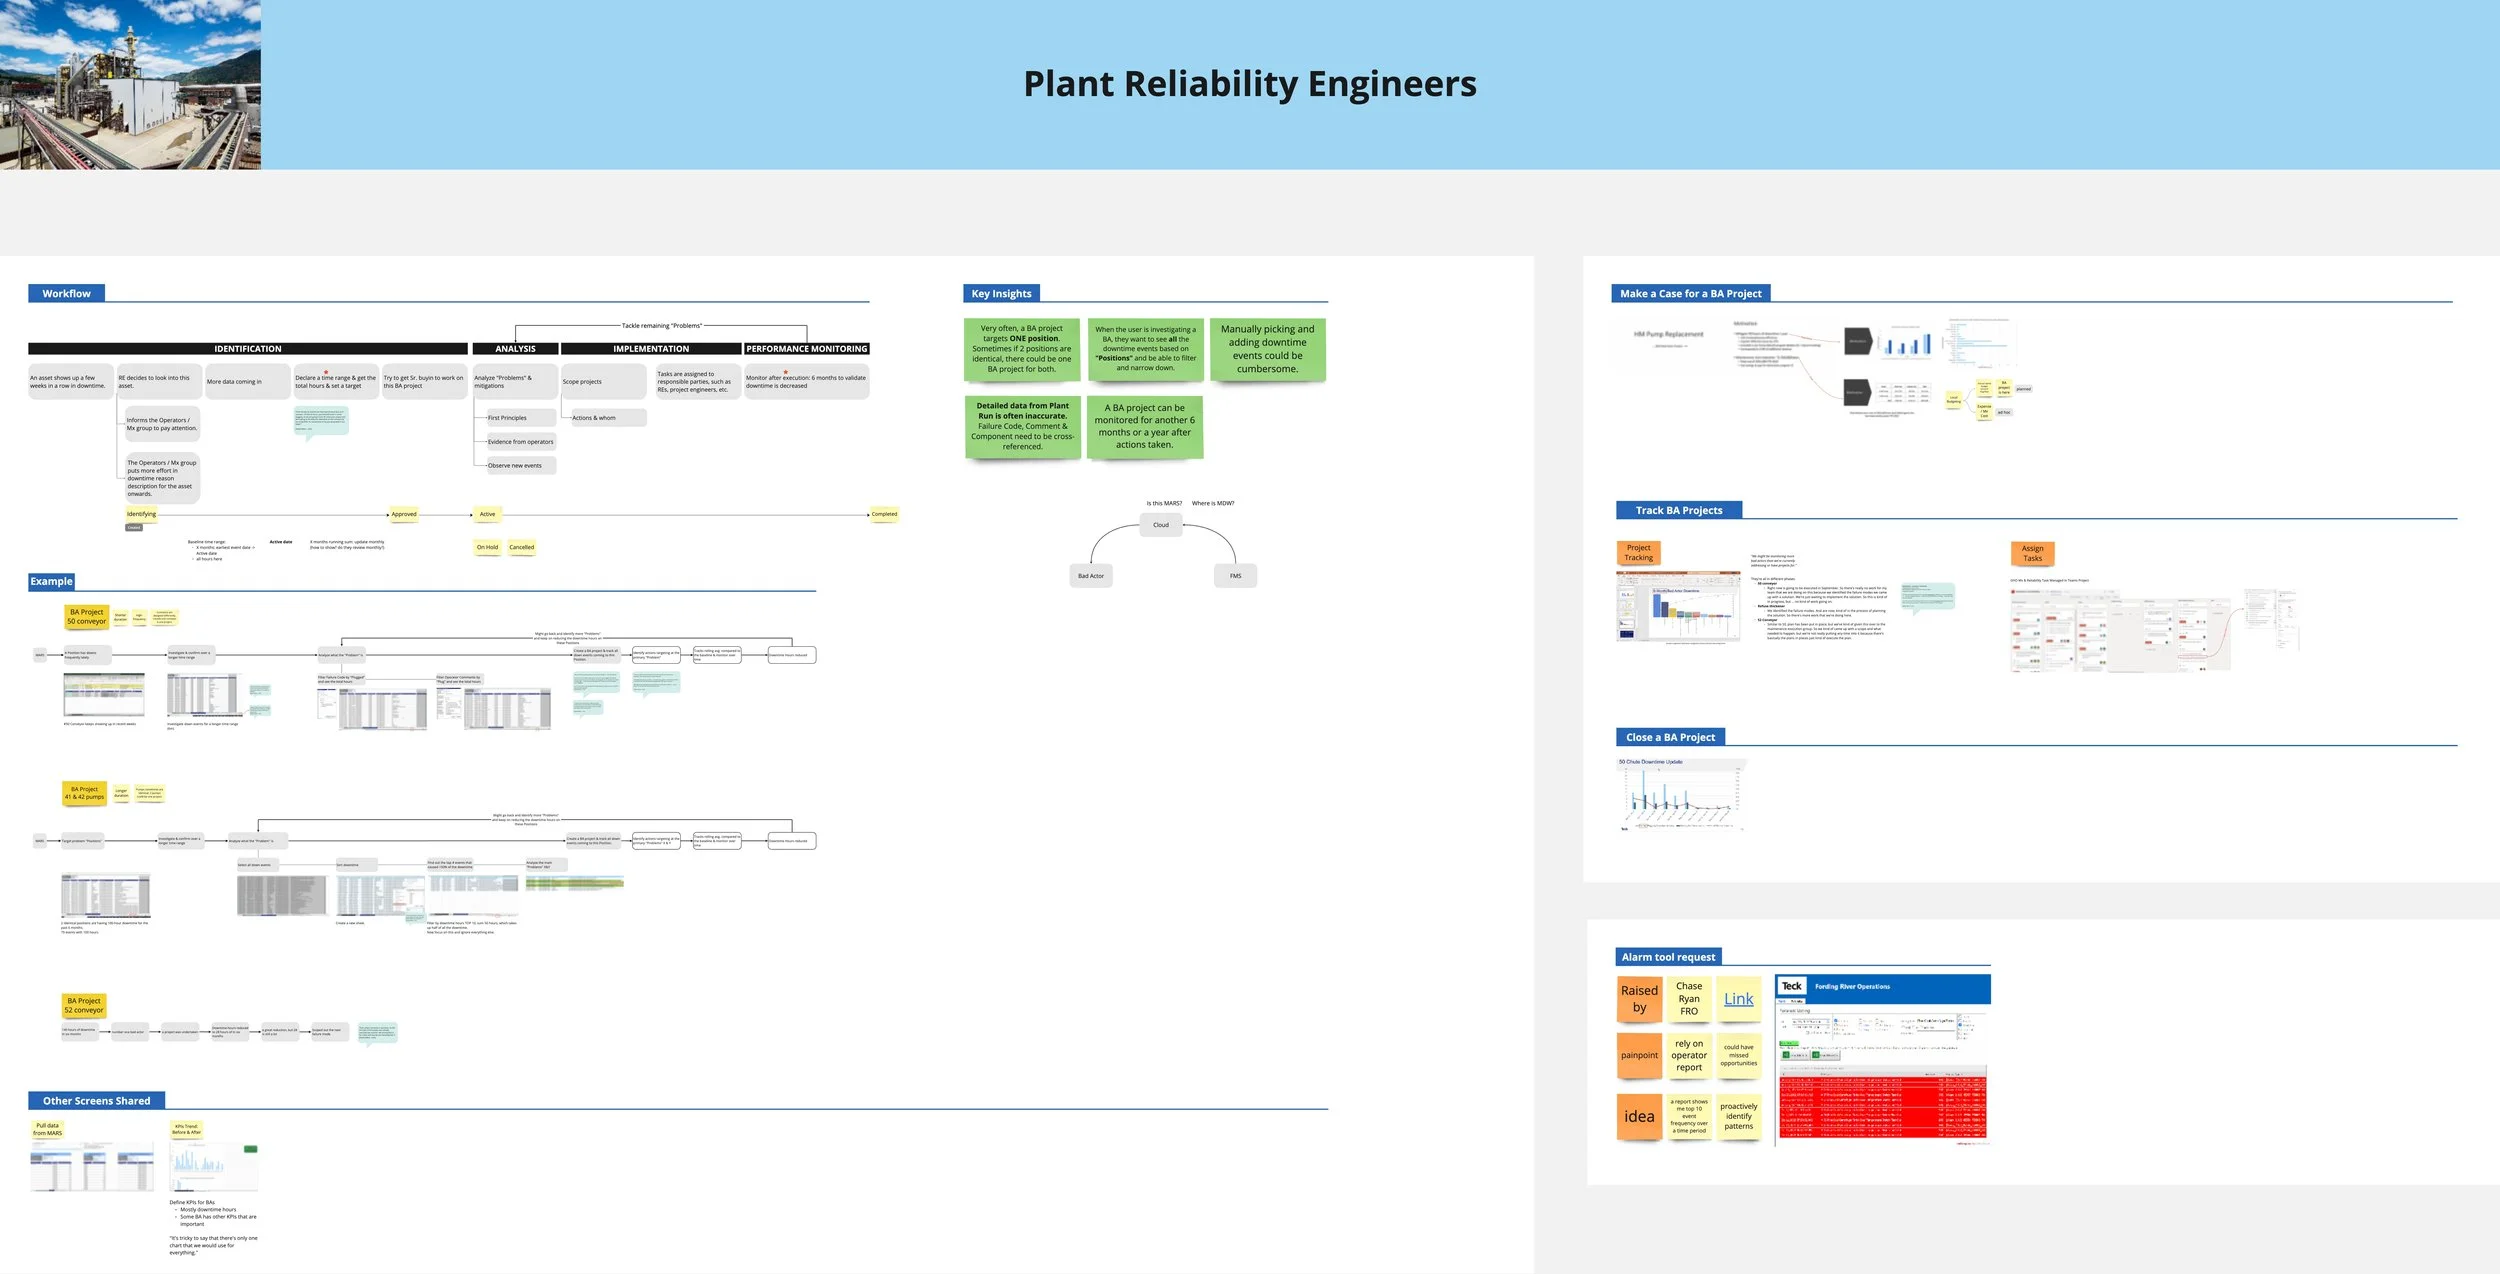
Mobile & Plant Reliability Engineer: Personas & Workflows
The early sketch was designed to address the data quality issues we identified during the interviews, giving users control over their data.
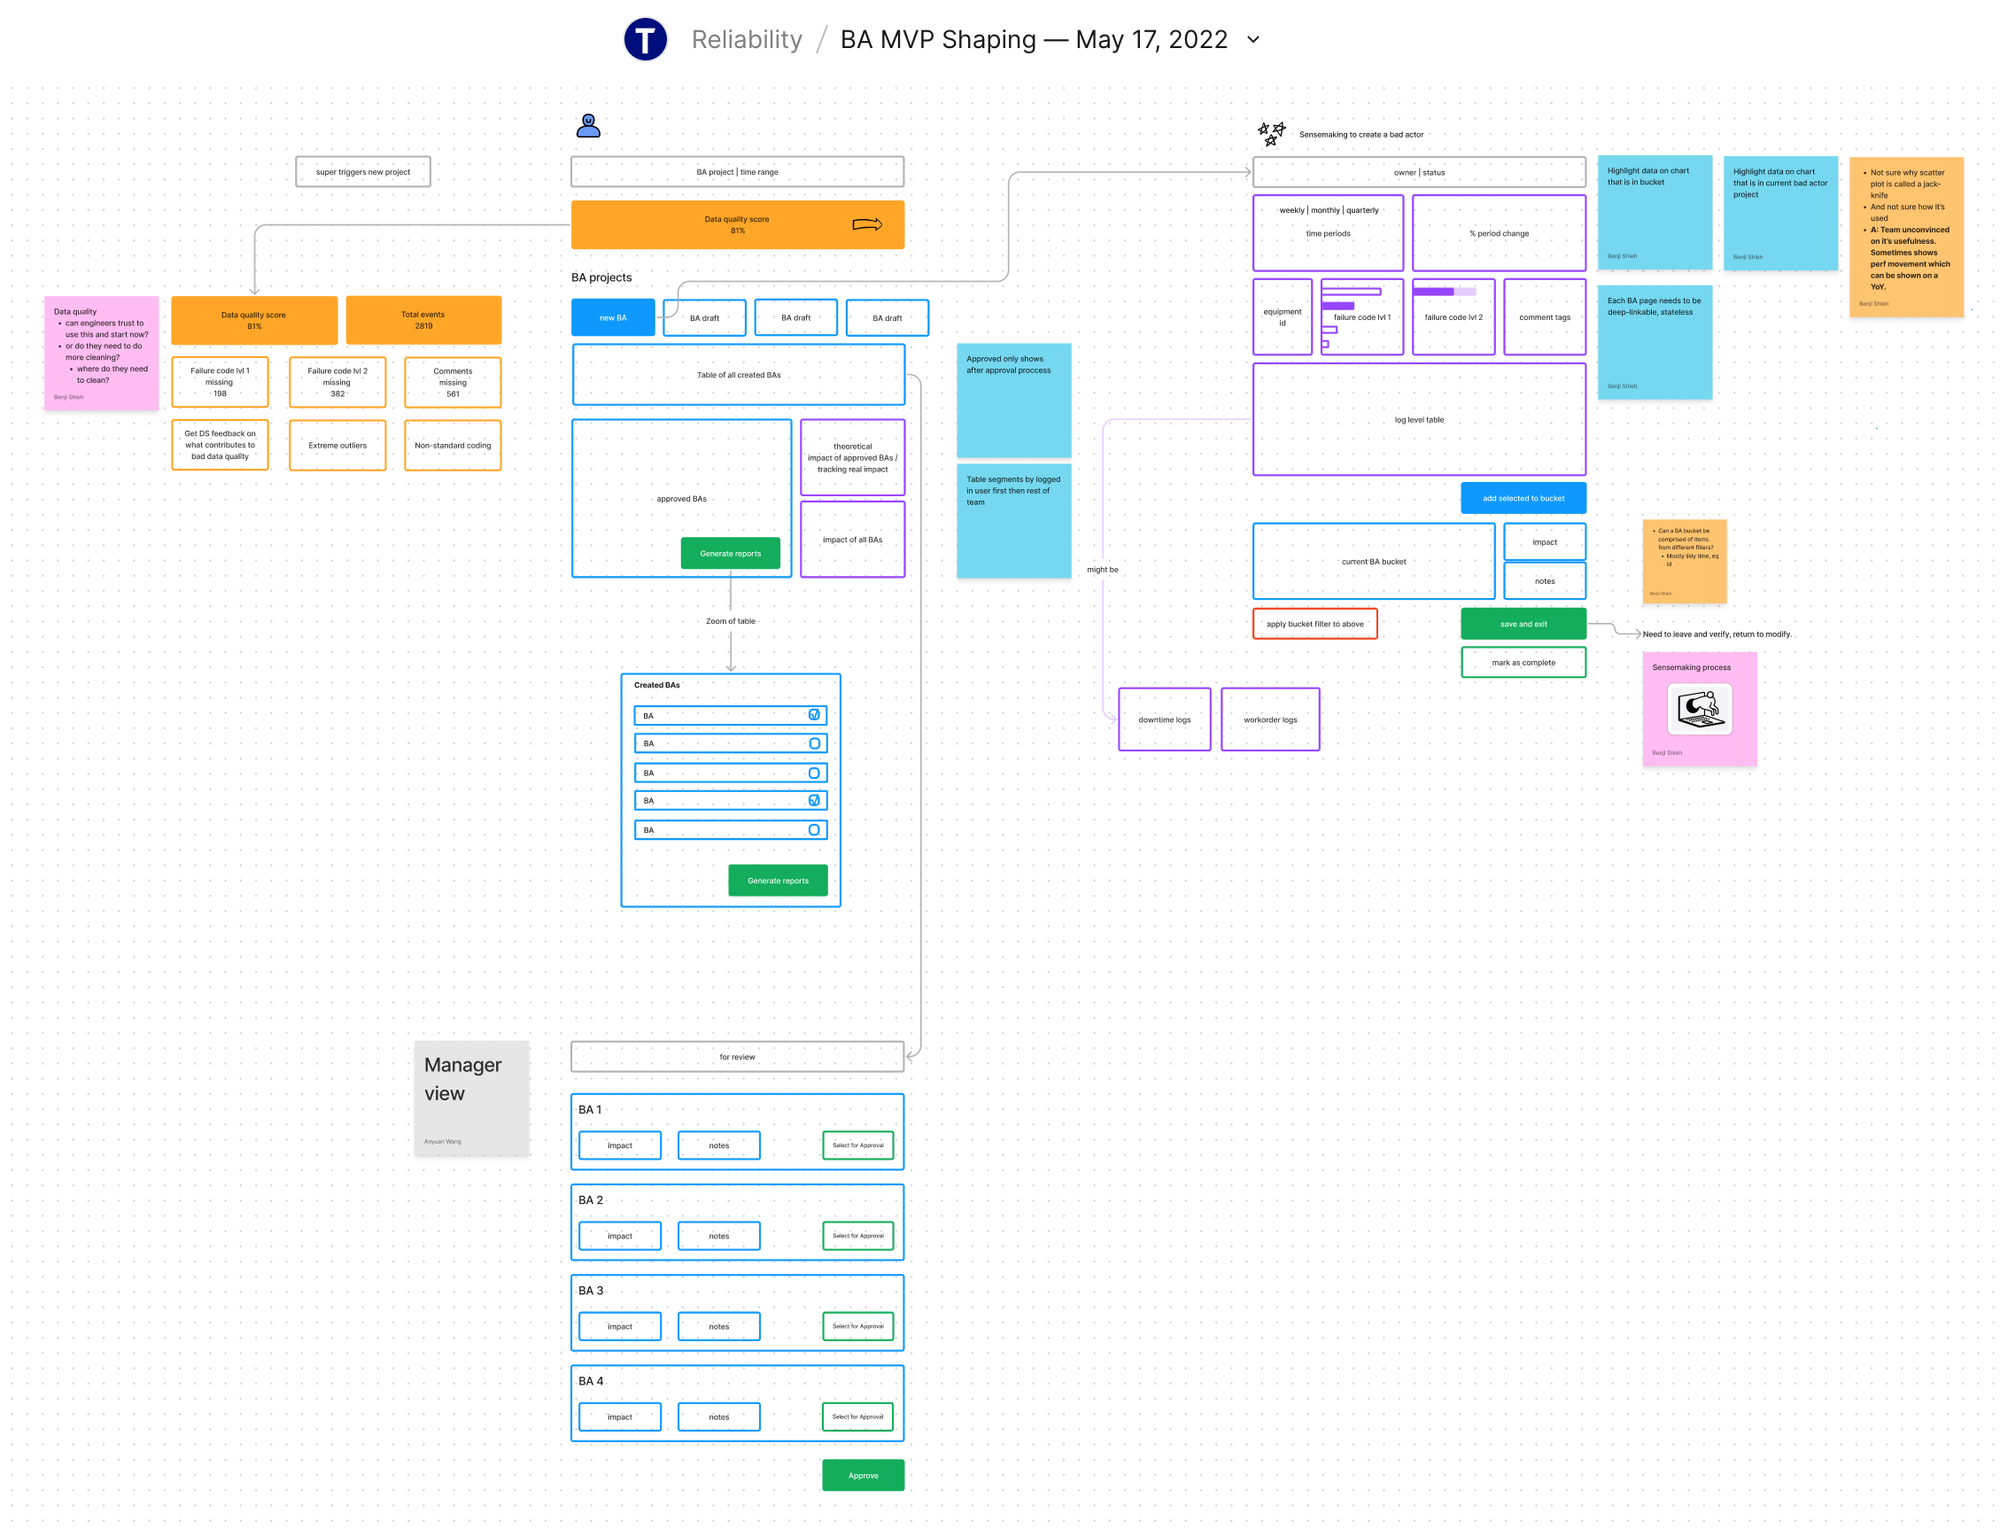
Early sketches
However, the Product team did not readily accept this concept. At that time, the stakeholders (Central Maintenance Group) had a specific idea they wanted us to implement.
Test with Early Prototype, Pivot, & Test Again
Initial Concept: Business-defined Bad Actors
The stakeholders were developing a New Business Standard for the Bad Actor process. We created our initial wireframes to align with this standard.
Pre-defined Bad Actors List: Curated using the "Position-Component-Failure Code" combined with downtime hours data.
Status Column: Users can now activate a Bad Actor they want to work on.
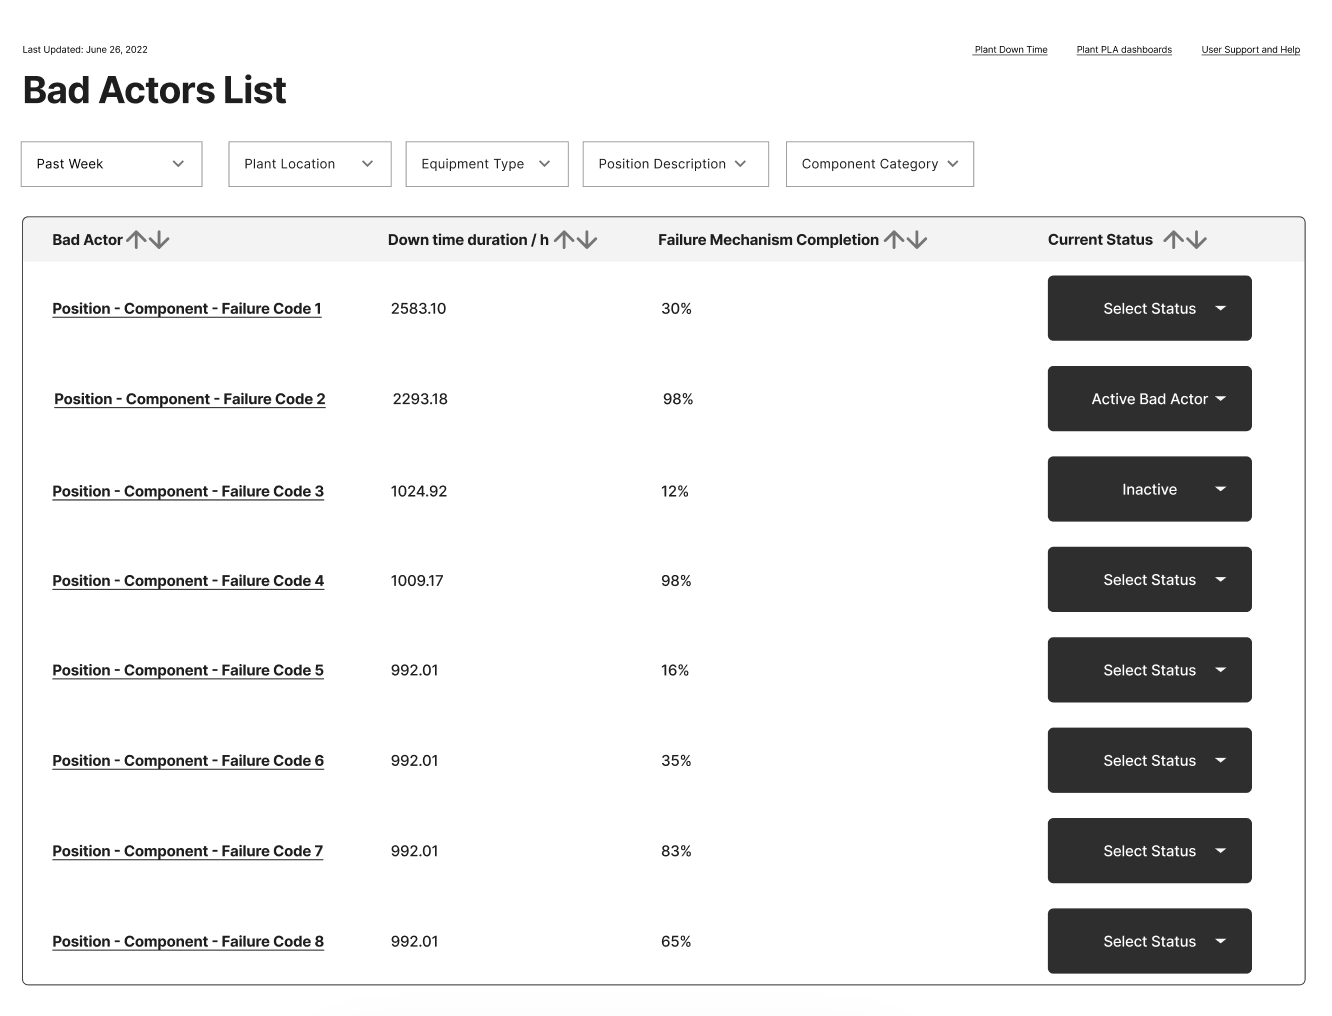
However, I was skeptical that this could work for our users given the data quality issues identified in the interviews. I suggested conducting a usability testing session to validate this idea, and the team agreed.
I quickly developed a prototype and conducted the first round of usability testing.
V0
video calls
first round usability testing results
The results confirmed my concerns: the new business standard was not working for our users.
The primary issues were that the definition of a Bad Actor Project was too inflexible and that the current data quality was insufficient to support the model. Additionally, data quality varied across different mine sites. For the solution to be scalable, it needed to work for all mine sites.
We reported these issues to the Central Maintenance Group and convinced them that users needed the flexibility to collect their own data and create their own projects.
Pivot: collect data & self define bad actors
With the client’s help on Information Architecture, I provided page structure for different levels of information that would help the user navigate and find their content.
We now have a better understanding of how our users want to collect their own data and identify "Bad Actor" projects.
To support their workflow, I created two versions to support the data collection phase:
V1 - Table Drill Down: The user can expand data from a higher level to view details and events on a separate page.
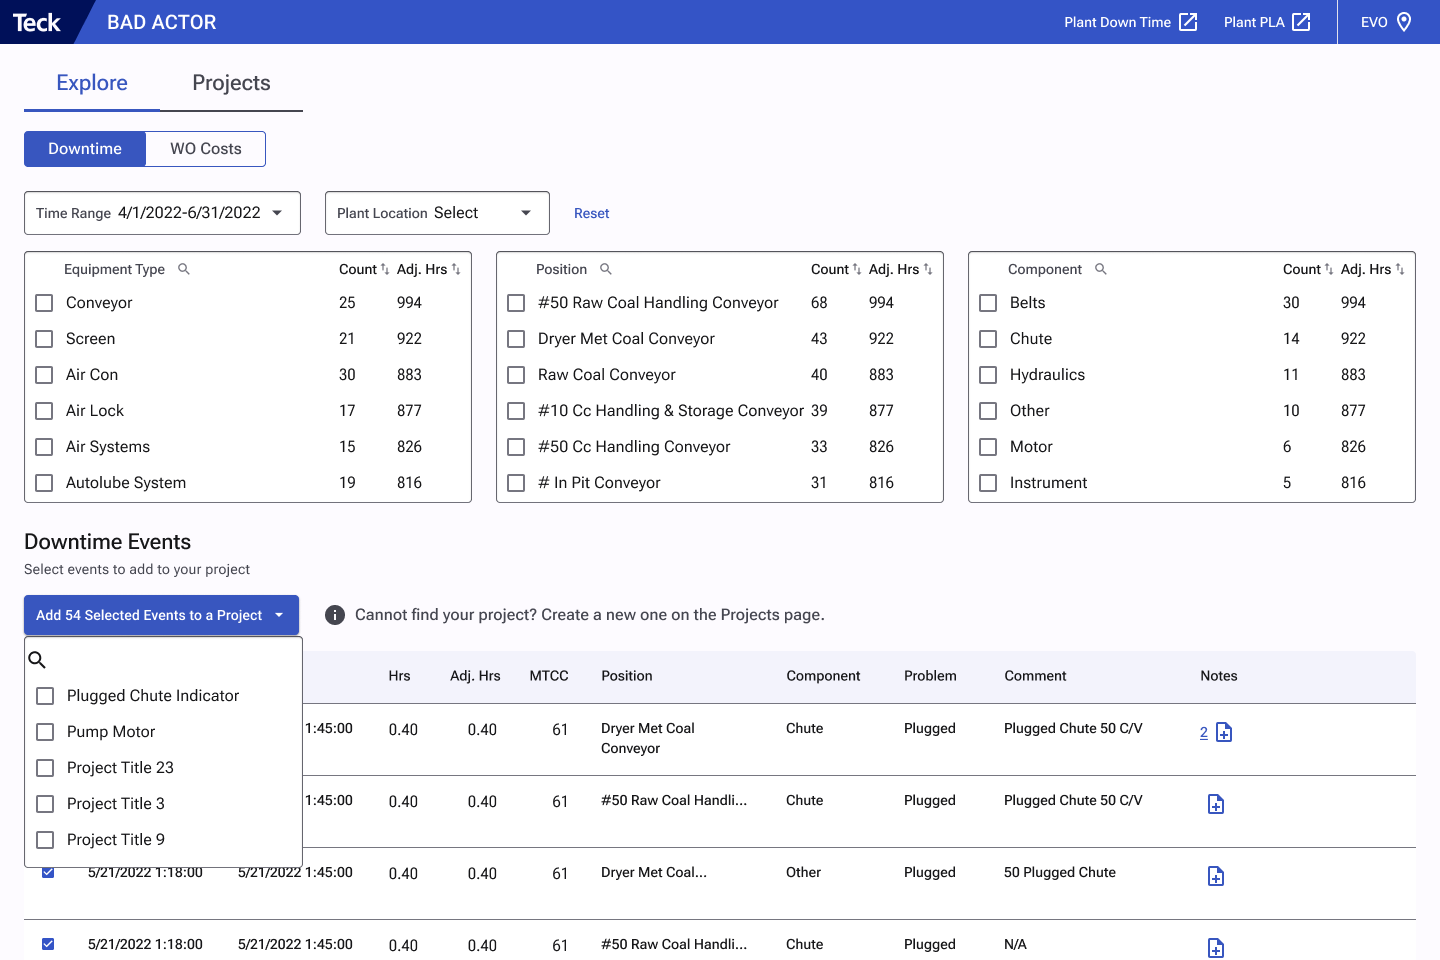
V2 - Interactive List: The user can click on the charts to filter out events on the same page.
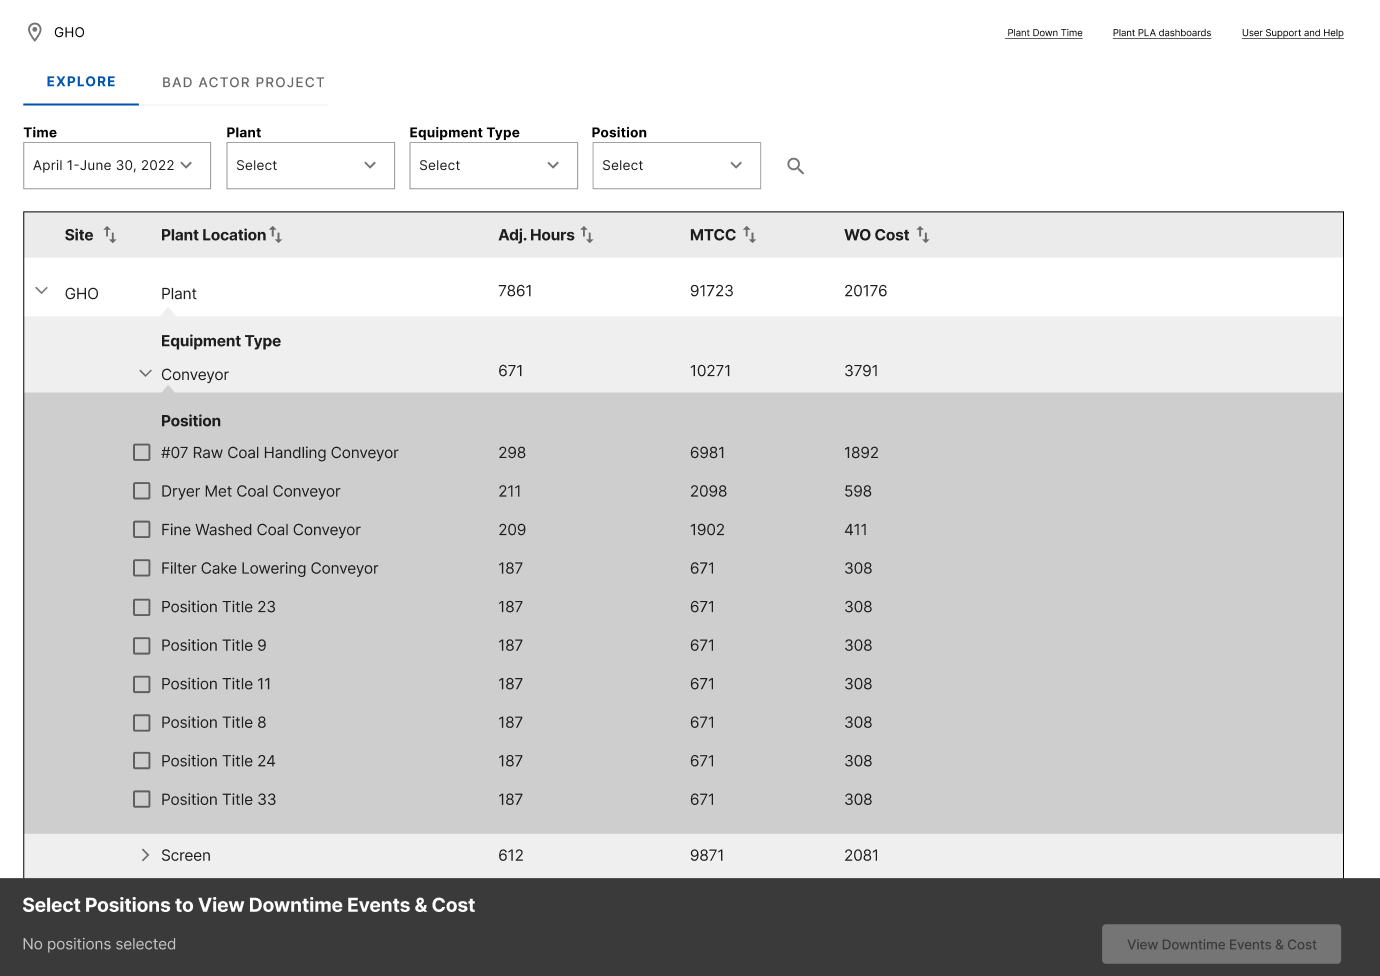
V1 Table Drilldown
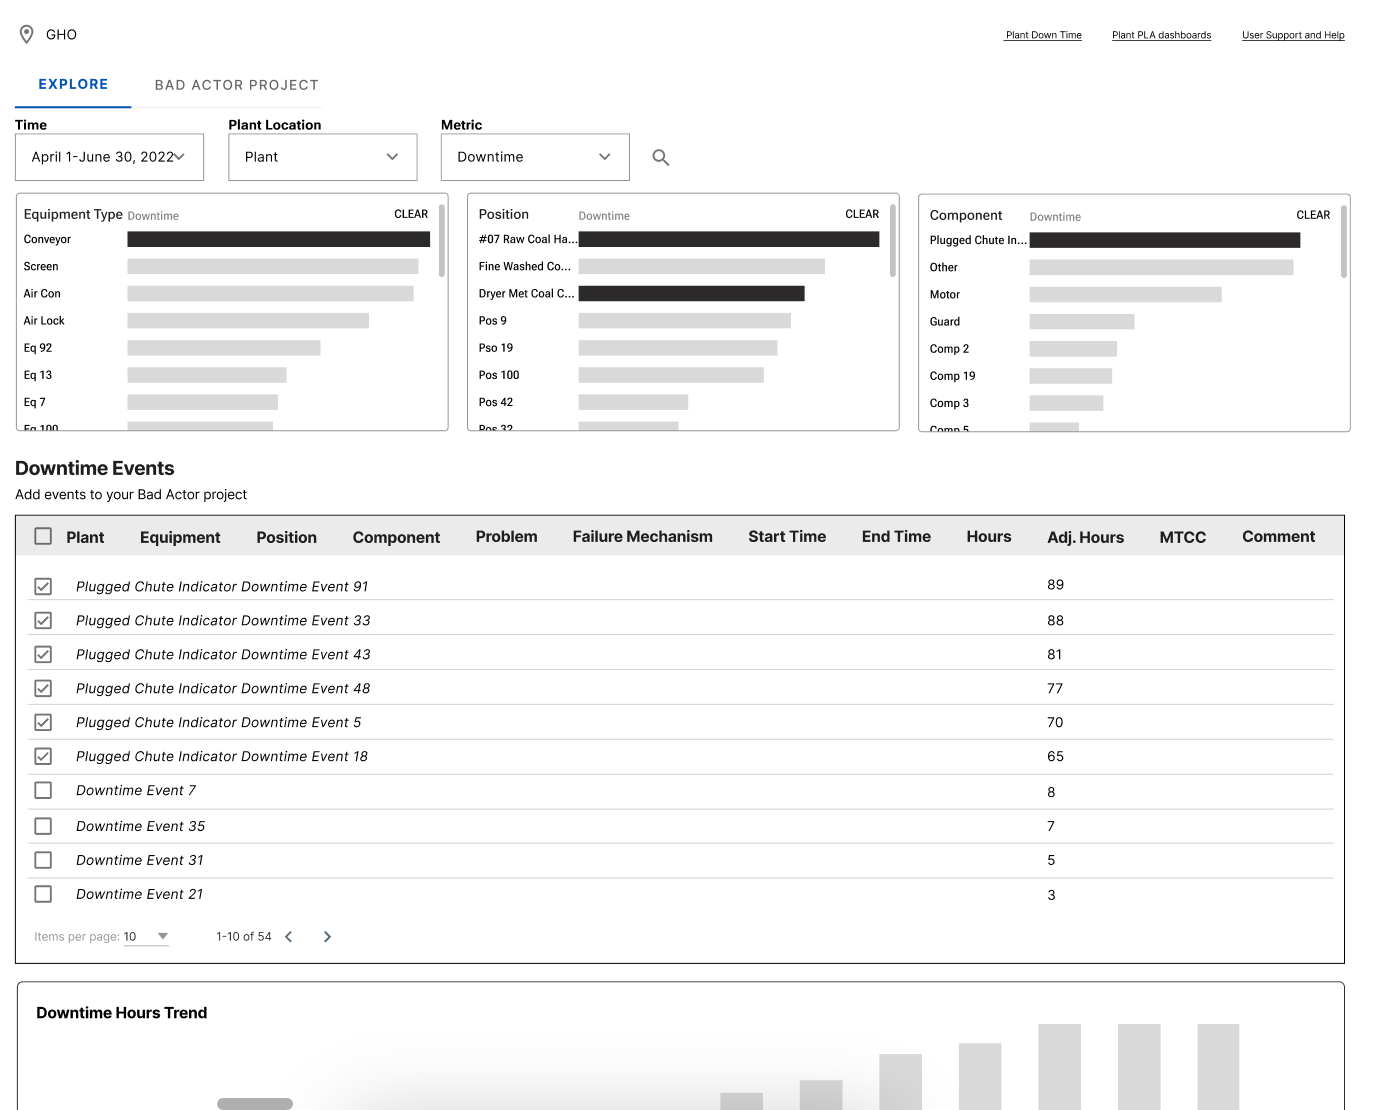
V2 Interactive List
Next, I conducted the second round of usability testings.
V1: Table Drill Down
V2: Interactive List
second round usability testing results
Users preferred V2, which was also endorsed by the technical team. V2's ease of implementation further solidified its selection, leading to full team alignment.
Hi-Fi Design
After validating the high-level workflow with our users, I began working on the details with feedback from the users, the business, and the technical team. Here are some examples:
Identifying projects based on their "position".
Automatically pulling new events based on project metadata.
Simplifying the interactive list to accommodate the timeline.
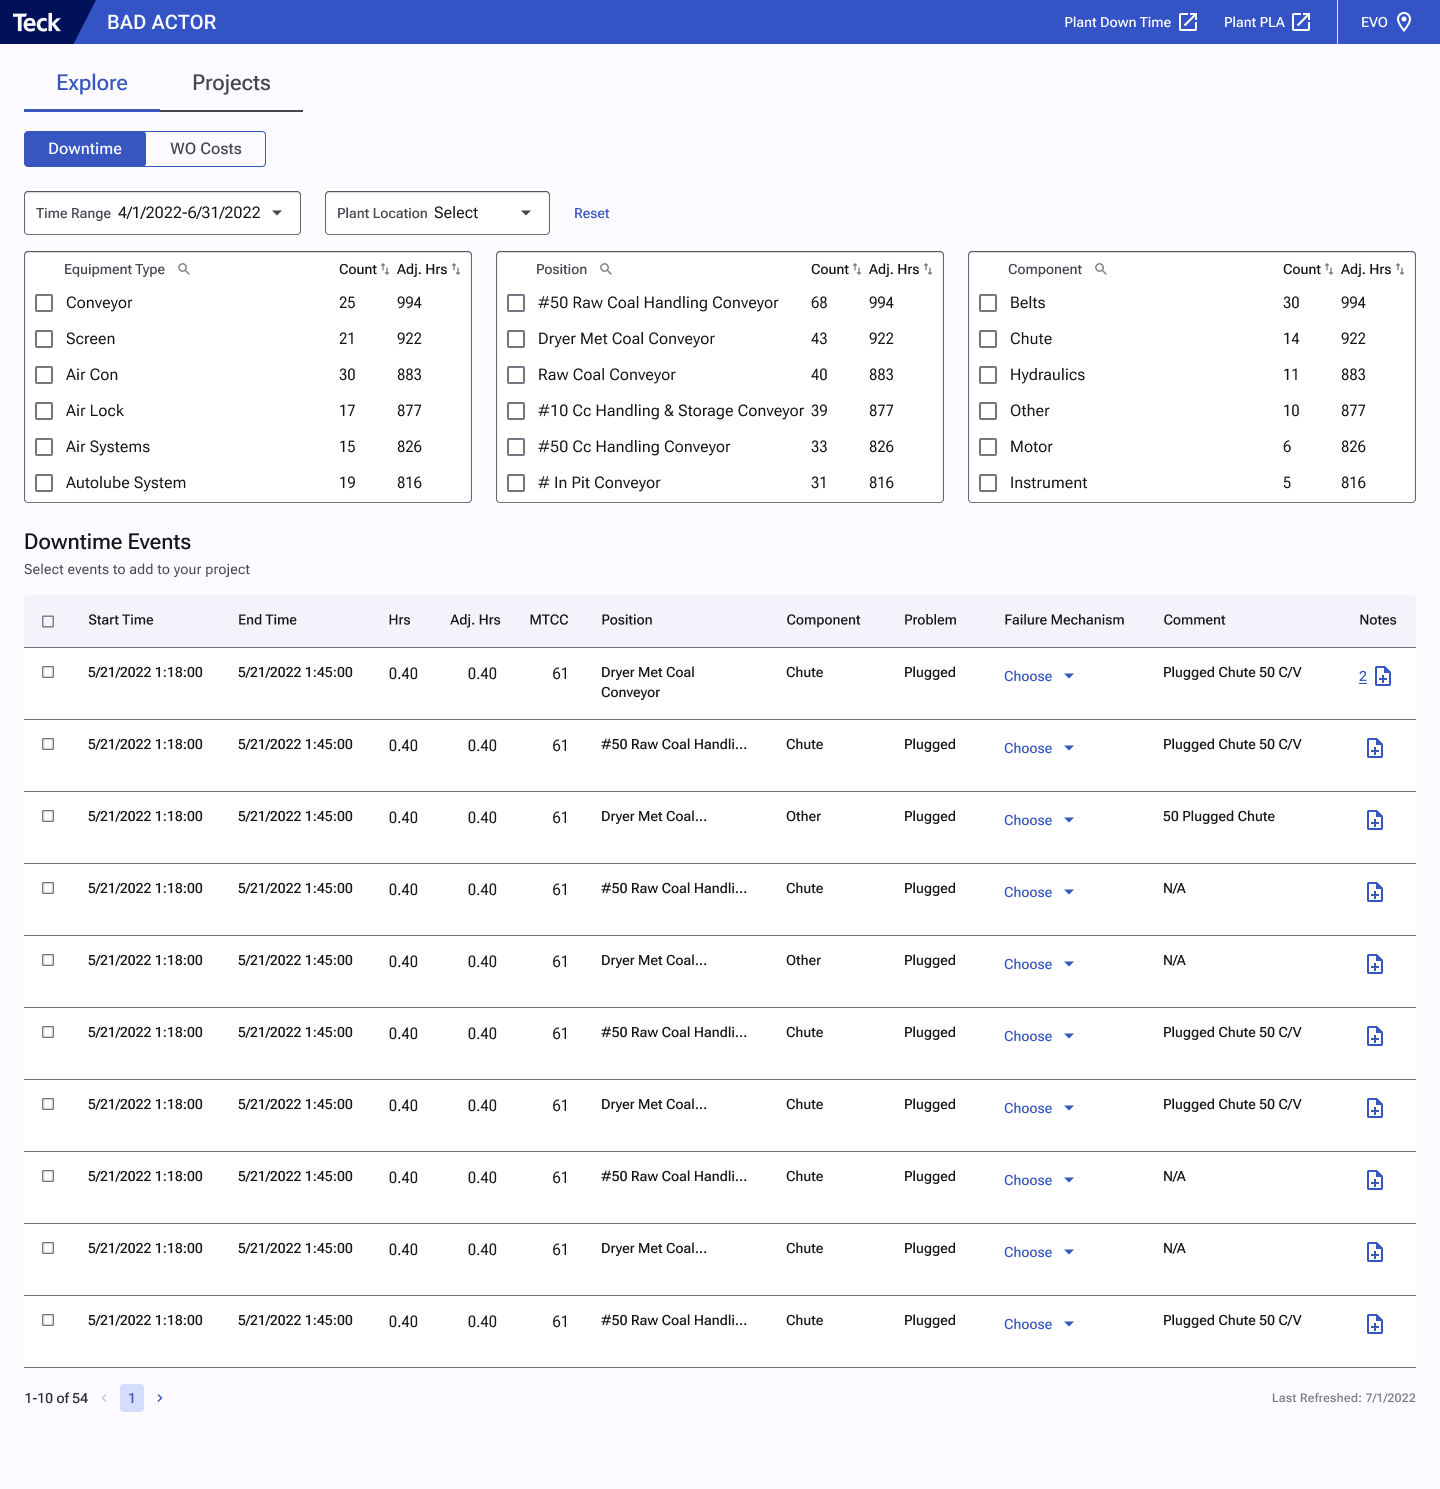
Explore raw data
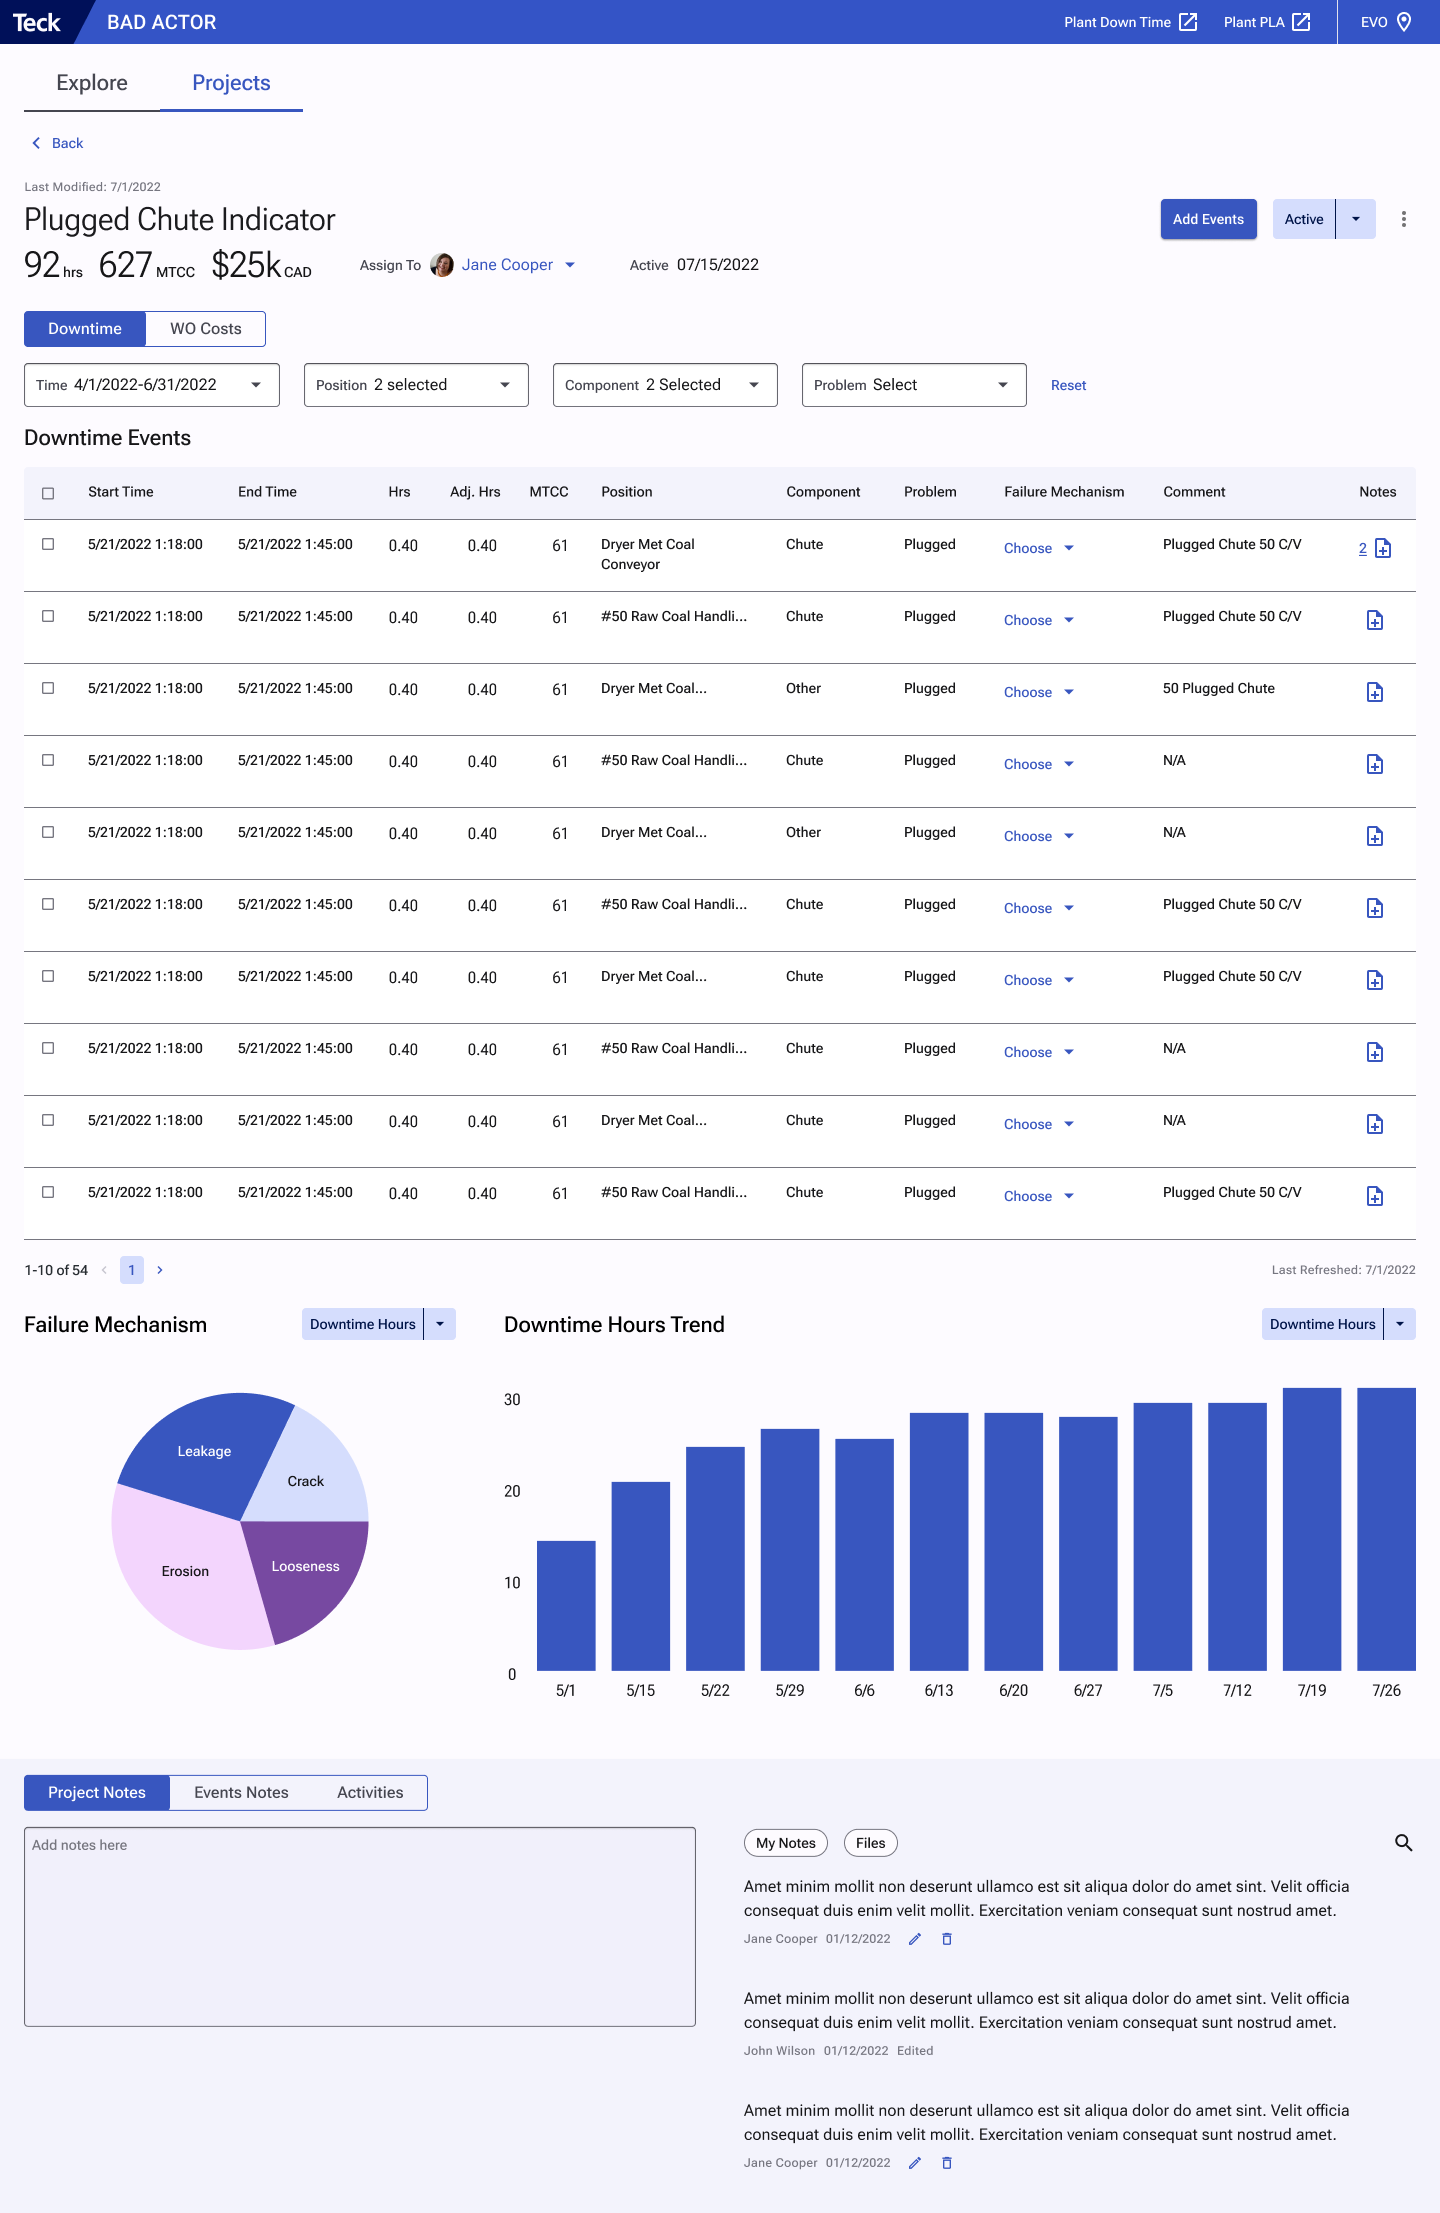
Project details
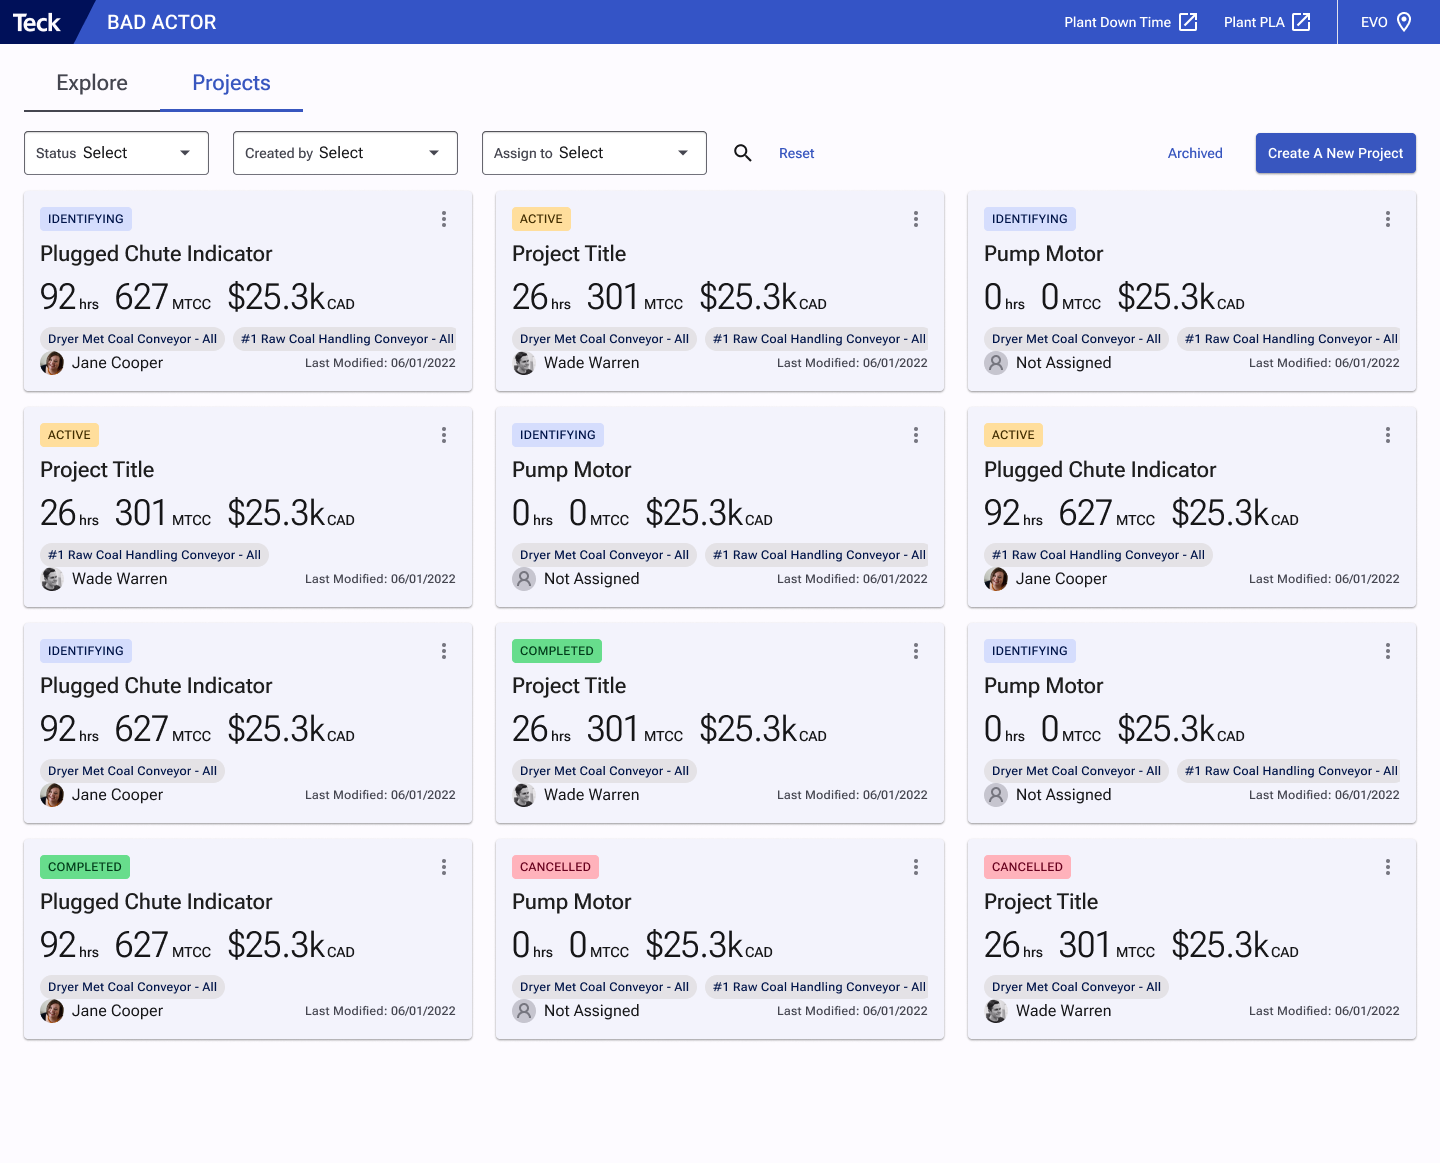
Projects list
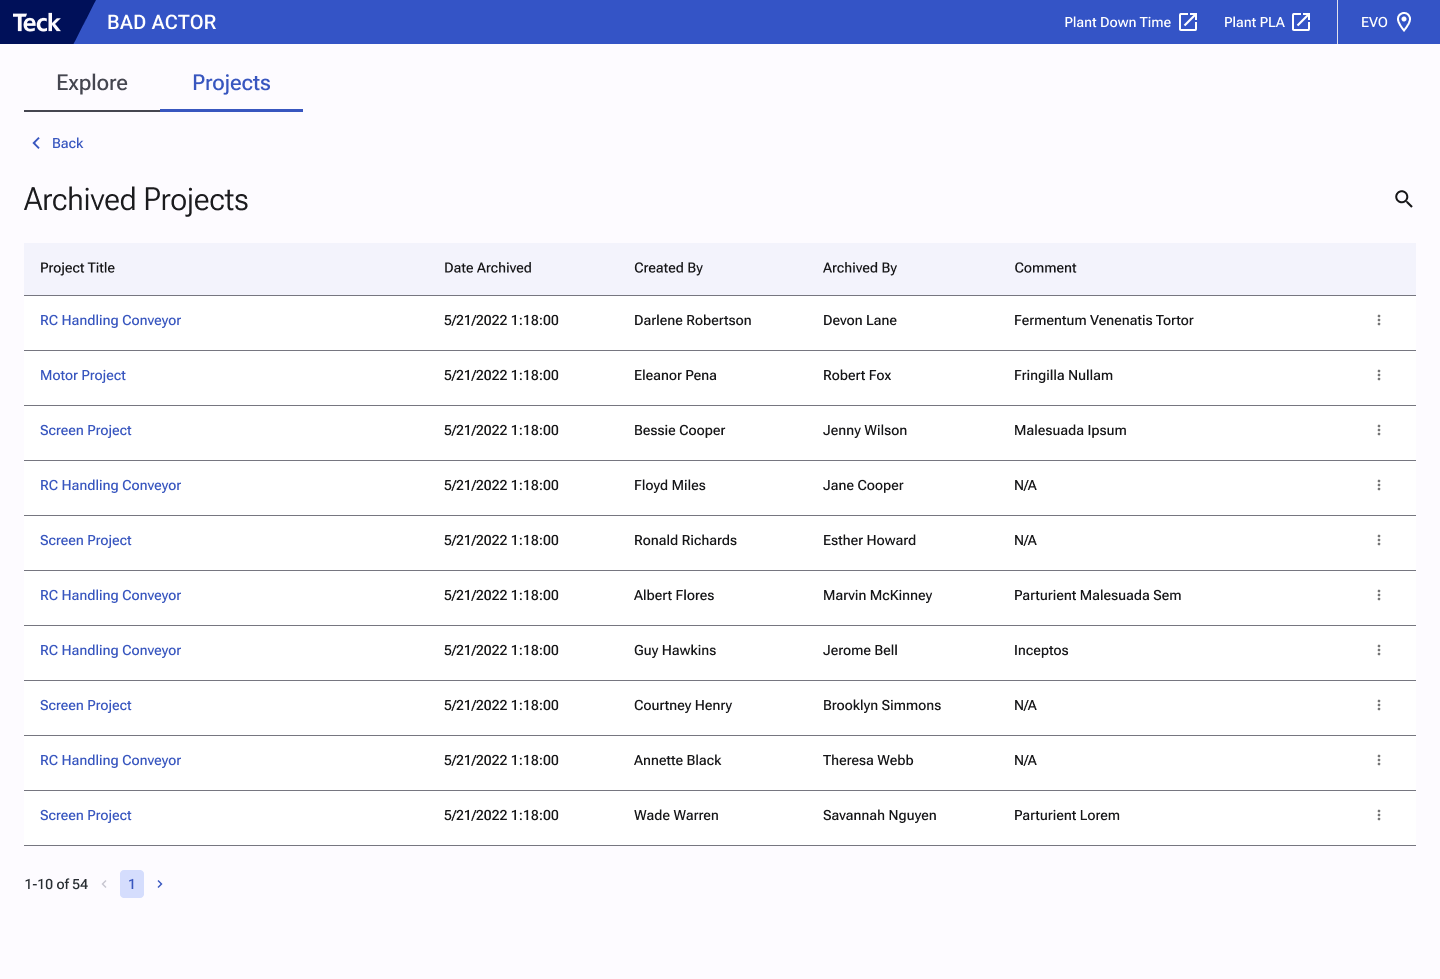
Archived projects
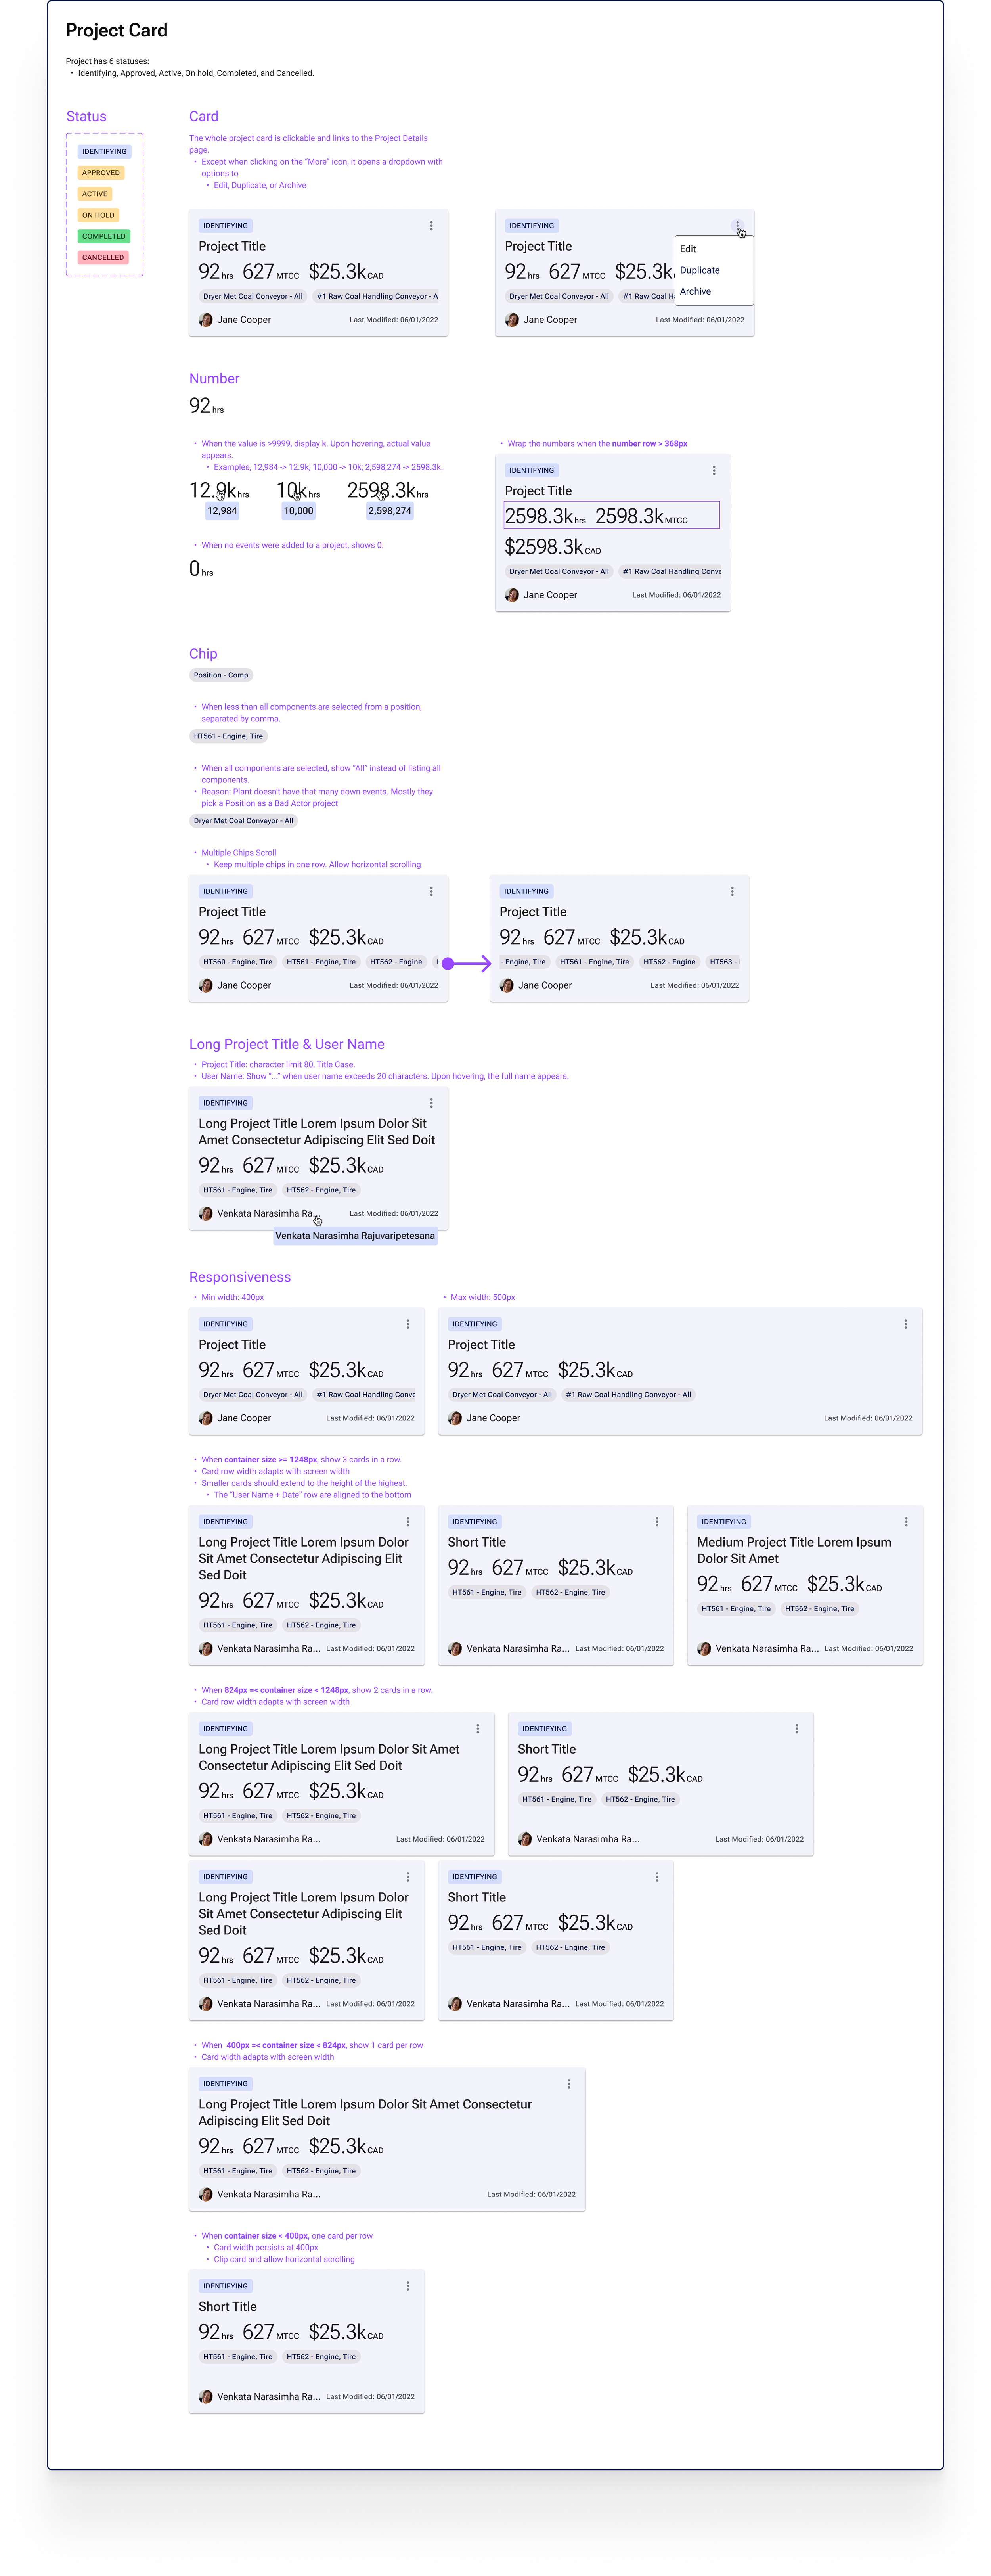
I documented the specifications and interaction details for each component in order to hand off the design to the developers. Below is an example of a Project Card.
Result
Users reported that the app is easy to use. Even for new engineers, it takes little effort to navigate around the app.
Users felt engaged in the design process, with their feedback collected through monthly user update sessions and usability testing. They saw their ideas being incorporated with each major iteration.
Saved Reliability Engineers 1-4 hours per week managing and analyzing data.
Saved ~ $12m spent on gathering data across all sites.